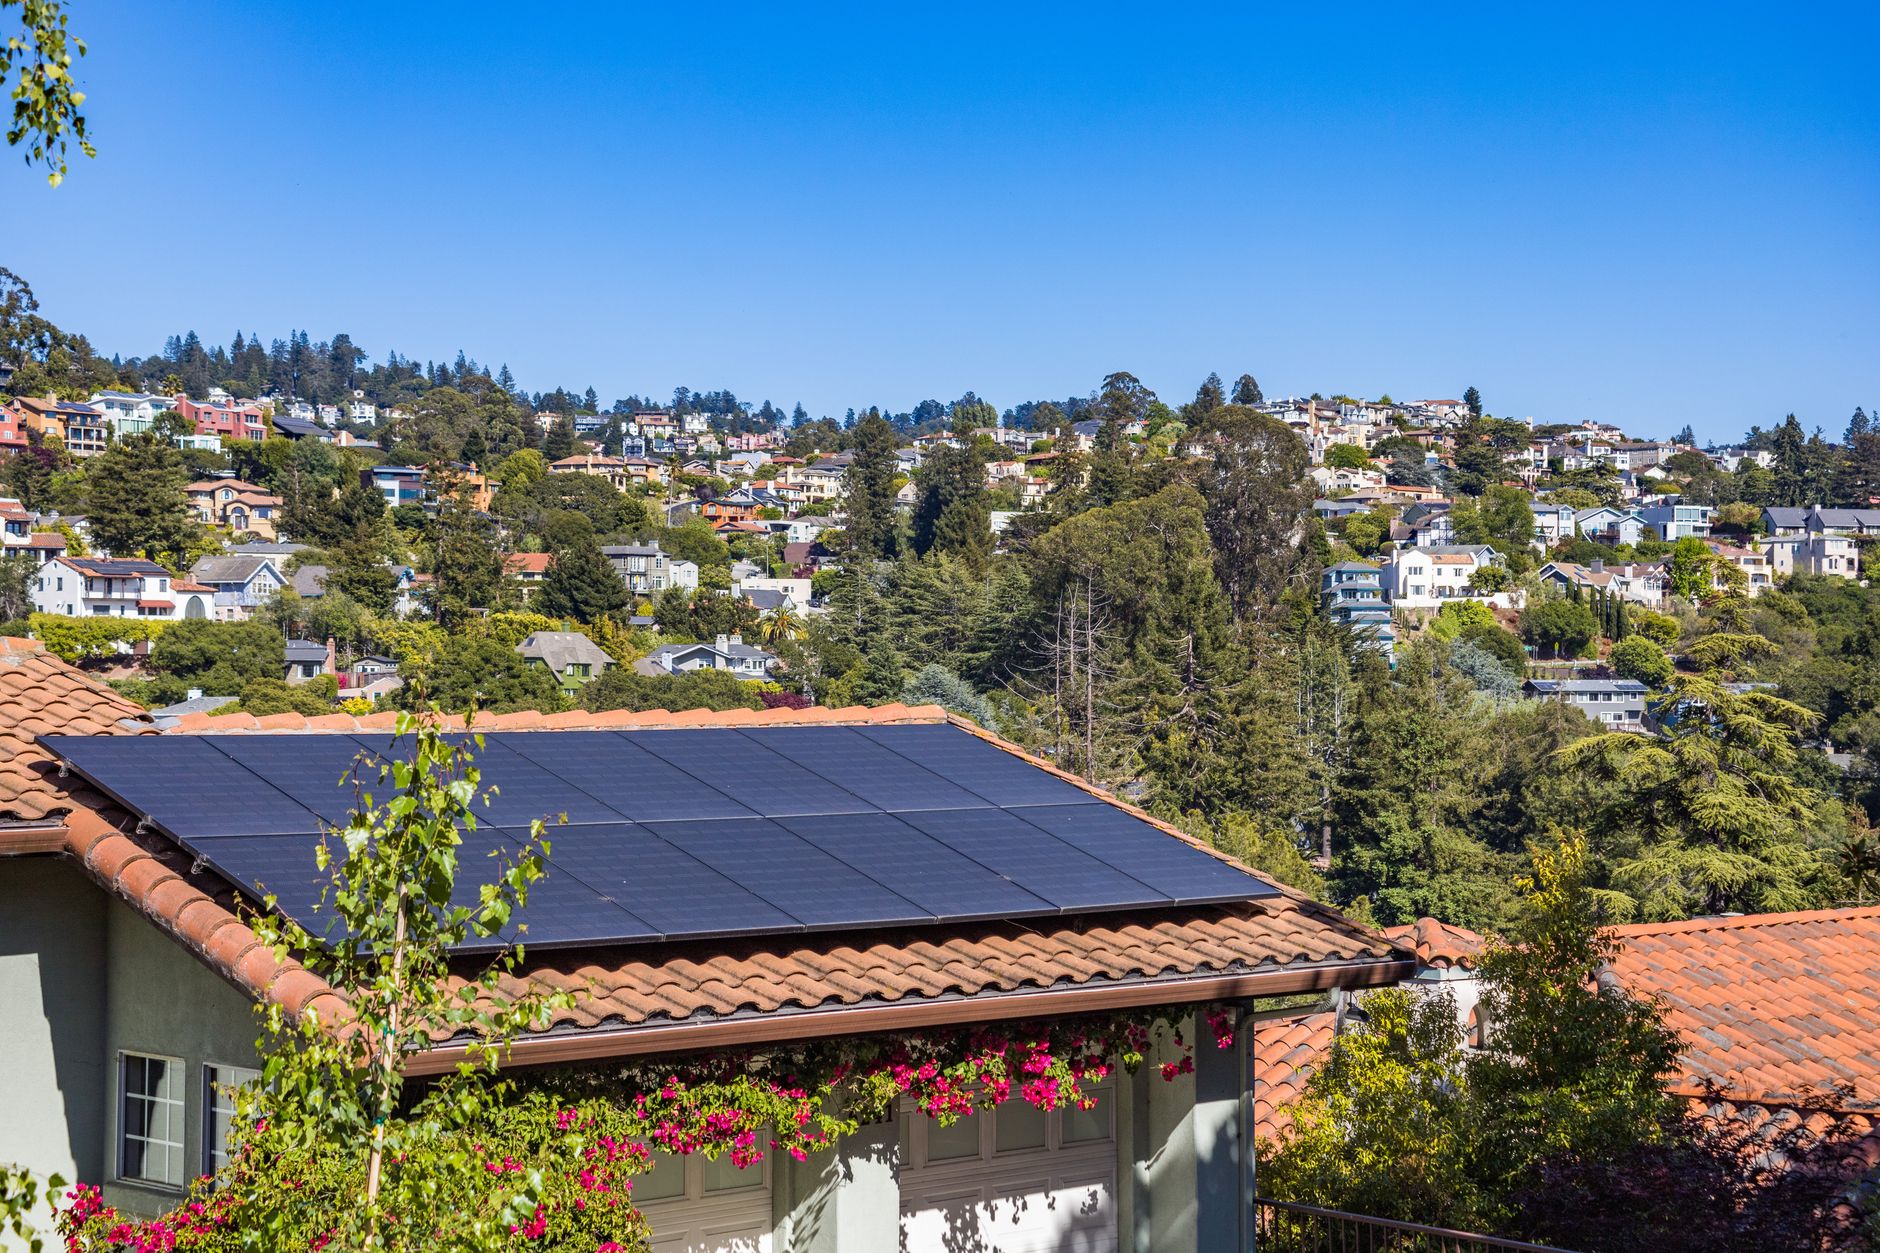
Solar panels remain a highly viable investment for most homeowners in 2026, offering substantial long-term savings and energy independence. According to EnergySage data, the average homeowner can save between $37,000 and $154,000 over 25 years, with most saving around $60,000 across the operating lifetime of a residential array. The financial case for solar remains compelling due to steadily climbing utility electricity rates, which historically increase by roughly 2.8% annually nationwide.
Key factors determining solar worthiness include property ownership, local grid tariffs, and roof structural orientation. Solar delivers the highest return on investment for homeowners with elevated monthly kilowatt-hour consumption and unshaded, south- or west-facing roof planes. While national pricing fluctuates, an average 12 kW residential system costs around $30,505 before incentives in 2026, though obtaining multiple competitive bids can lower project expenses by up to 20%. Pairings with home battery storage, which add approximately $12,000 to $16,000, are increasingly necessary under modernized utility rate structures to preserve economic value and secure reliable backup power.
Conversely, solar may yield marginal returns for renters, occupants with minimal utility draw, or properties facing severe canopy shading. How a homeowner finances an installation—through cash purchase, secured solar loans, or third-party power purchase agreements (PPAs)—directly dictates payback velocity. Most residential owners realize full break-even within 8 to 11 years, after which the electricity generated is effectively free.
| Metric | Average Benchmark (2026) | Impact on Homeowner ROI |
|---|---|---|
| Average System Cost (12 kW gross) | $30,505 | Baseline capital expense prior to federal or regional credits |
| Federal Investment Tax Credit (ITC) | 30% of system cost | Deducts an average of $9,150 from gross installation balance |
| Average Payback Period | 9.5 – 10.5 years | Accelerates with high local utility tariffs and time-of-use optimization |
| 25-Year Cumulative Savings | $37,000 – $154,000 | Protects household budgets against ongoing retail rate inflation |
| Annual Degradation Rate | 0.3% – 0.5% per year | Modern N-type TOPCon and heterojunction panels retain >85% capacity at year 25 |
| Battery Storage Integration Cost | $11,500 – $15,500 | Enables self-consumption arbitrage under net billing (NEM 3.0) frameworks |
Understanding Federal and State Financial Incentives
The foundational driver of residential solar affordability remains the federal Residential Clean Energy Credit under Section 25D. This provision enables homeowners who purchase their systems outright or through solar financing to deduct 30% of total equipment and installation costs from their federal tax liability. For an average $30,500 system, this single credit immediately lowers the net financial commitment by $9,150.
Beyond federal support, state and municipal clean energy programs significantly alter project economics. Various states offer Solar Renewable Energy Certificates (SRECs), performance-based incentives, and property tax exemptions that prevent solar additions from triggering higher assessed property valuations. Homeowners evaluating potential return on investment must calculate their net project expense only after subtracting both the 30% federal credit and applicable regional rebates.
The Shift to NEM 3.0 and the Necessity of Solar Battery Storage
One of the most consequential shifts in solar economics over the last several years is the transition away from traditional 1-to-1 net energy metering (NEM). Historically, utilities credited homeowners the full retail rate for surplus electricity sent back to the grid during peak daytime hours. Under updated frameworks such as California's Net Billing Tariff (commonly referenced as NEM 3.0) and similar successor programs across multiple states, export compensation rates have decreased by up to 70% to 80%.
As a result, standalone grid-tied photovoltaic arrays in deregulated or updated markets capture lower export revenue during peak midday production. To optimize economic performance under modern net billing, integrating a lithium iron phosphate (LFP) battery energy storage system (BESS) has shifted from an optional luxury to an economic asset. Batteries allow households to store midday generation on-site and discharge stored capacity during expensive evening peak-demand windows, effectively bypassing elevated time-of-use (TOU) rates.
Key Takeaway: Under modern net billing structures, export compensation for excess daytime generation is significantly reduced. Integrating energy storage allows households to capture peak value through on-site load shifting rather than exporting cheap power to the grid.
Panel Efficiency, Degradation, and Inverter Architecture
Evaluating equipment quality is critical when modeling financial performance over a 25- to 30-year operational lifecycle. In 2026, mainstream solar installations predominantly utilize high-efficiency monocrystalline cells, specifically Tunnel Oxide Passivated Contact (TOPCon) and Heterojunction Technology (HJT) architectures, delivering operational module efficiencies between 21.5% and 23.5%.
Hardware longevity is defined by two key technical factors:
- Annual Degradation Rates: Premium tier-1 photovoltaic panels exhibit degradation rates between 0.3% and 0.5% annually. This guarantees that panels generate at least 85% to 90% of their initial rated nameplate capacity at the end of their standard 25-year performance warranty.
- Inverter Lifecycles and Topologies: System architecture typically relies on either module-level power electronics (microinverters) or central string inverters paired with DC power optimizers. While panels frequently last 30 years, string inverters carry standard lifespans of 10 to 15 years, requiring homeowners to budget for a mid-lifecycle replacement. Microinverters, by contrast, routinely match the 25-year warranty of the PV modules themselves.
Comparative Analysis of Solar Financing Models
How a clean energy system is acquired fundamentally shapes its financial return. Homeowners generally select between three distinct procurement paths:
- Cash Purchases: Direct purchasing yields the fastest cumulative return on investment and highest overall lifetime savings. Homeowners avoid finance fees, maintain full eligibility for the 30% federal tax credit, and own the equipment as a tangible asset from day one.
- Solar Loans: Secured or unsecured loans allow homeowners to finance the system with low or zero upfront capital while retaining the federal tax credit. Monthly loan payments are often structured to be lower than or equal to the displaced utility bill, generating net savings immediately upon system interconnection.
- Solar Leases and Power Purchase Agreements (PPAs): Under third-party ownership models, the developer retains the federal tax credit and leases the hardware or sells the produced power back to the resident at a contracted rate. While requiring zero initial expense, PPAs yield substantially lower long-term financial returns and can complicate property sales if the incoming buyer declines to assume the lease agreement.
Evaluating Roof Integrity, Orientation, and Electrical Infrastructure
Prior to signing an installation contract, thorough technical site validation is required to prevent unexpected auxiliary costs. Solar arrays possess an operating life exceeding two decades; consequently, installing panels over an asphalt shingle roof with less than 10 to 15 years of remaining structural life is not recommended, as removing and reinstalling panels during a reroof typically costs several thousand dollars.
Additionally, electrical service capacity must be reviewed. Older homes with 100-amp main breaker panels frequently require a service panel upgrade (MPU) to 200 amps to safely handle backfed solar generation and simultaneous battery storage loads. Verifying roof plane orientation (optimal between 180° south and 270° west in the northern hemisphere), shading profiles via LiDAR analysis, and electrical panel busbar capacity ensures accurate financial payback modeling.
Independent Decision Framework: Is Solar Right for Your Home?
Determining whether solar panels represent a sound financial allocation requires balancing localized utility costs against upfront capital expenditure. Solar represents an advantageous investment if:
- Your current blended electricity rate exceeds $0.16 per kilowatt-hour.
- Your local utility applies aggressive time-of-use price differentials or recurring rate hikes.
- Your roof structure has unobstructed sun access between 10:00 AM and 4:00 PM and does not require immediate replacement.
- You possess sufficient tax appetite to fully leverage the 30% federal clean energy credit.
For households with access to exceptionally cheap municipal power, properties experiencing severe vegetative shading, or owners planning to relocate within the next two to four years, the payback duration may not align with household timelines. Reviewing itemized quotes and independent production modeling remains the best course of action before committing to an installation contract.
Homeowners seeking unbiased project insights can consult independent energy advisors to evaluate local utility tariffs, site viability, and financing alternatives. Connect with an advisor to discuss technical feasibility and tailored system assessments.